Top 10 Visuals & Infographics on Langwitches
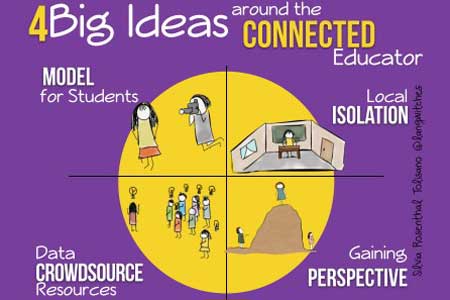
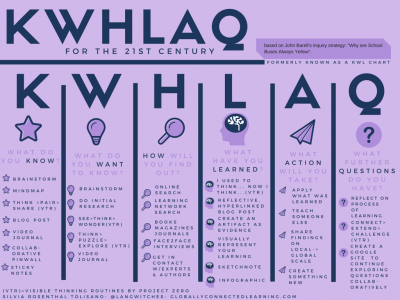
There is no question that I am a visual learner. Not only do visuals created by others help me make context and content clearer to me, but visuals also play a pivotal role in the process of thinking about, wrapping my mind around, developing, connecting, and making my work visible in order to share with others.
I have experimented with infographics, sketchnotes, slides, and hybrid visuals. I use tools such as:
- Piktochart
- Canva
- Paper by fiftythree
- Keynote
Here are the Top 10 Visuals & Infographics on Langwitches :
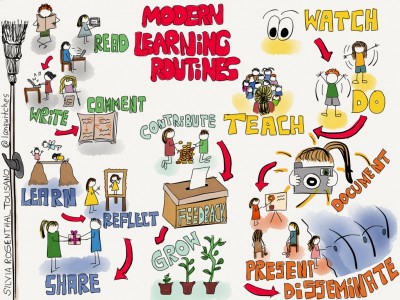
10- From Visible Thinking Routines to Modern Learning Routines
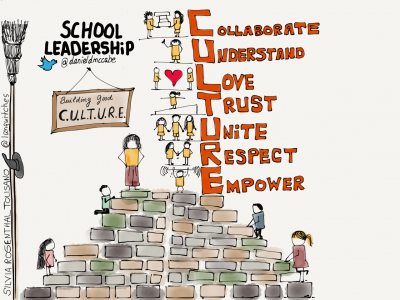
9- Building Google C.U.L.T.U.R.E
8- 4 Big Ideas Around the Connected Educator
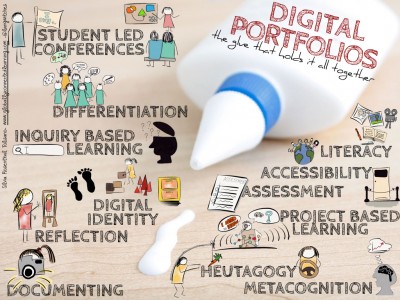
7-Digital Portfolios are the Glue that Holds it All Together
Tools and ideas to transform education. Sign up below.
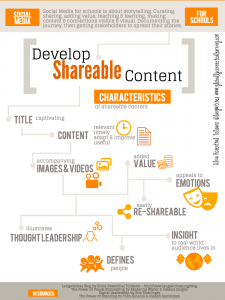
6- Develop Shareable Content For Schools
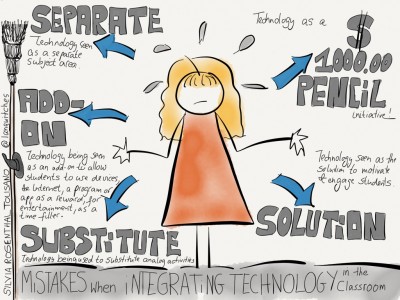
5- What are the Biggest Mistakes when Integrating Technology in the Classroom
4- Visible Thinking Routines in Blogging

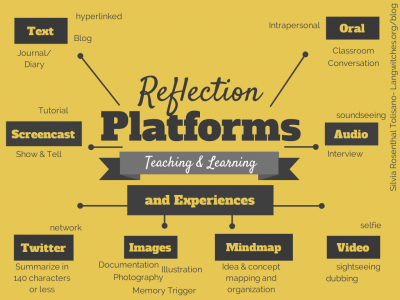
3- Reflection in the Learning Process, not as an add-on
2- Copyright Flowchart: Can I Use It? Yes? No? If This… Then…

cross posted at langwitches.org/blog
Silvia Tolisano is a Curriculum21 faculty member, author of the book Digital Storytelling Tools for Educators and founder of the Around the World with 80 Schools project. Read more at http://langwitches.org/blog.
