How Data Analytics Can Inform Back-to-School Planning
Data analytics tools can help schools assess the effectiveness of instructional planning, whether online, face-to-face, or blended.
With so many unknowns, time is more critical than ever for administrative teams to make decisions that are informed by as many facts as possible. There are numerous questions, such as “where, who, and what,” that need to be answered in order to plan for the 2020-2021 school year. Effective data analytics tools can also help schools answer a number of these critical questions by enabling them to assess the effectiveness of instructional planning, whether related to online, face-to-face, or blended models.
Using Geovisual Analytics to Identify Student Needs
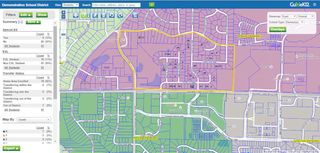
The need to understand questions that begin with “where” has become essential to effectively servicing all students. Inequities have been exacerbated by the switch to eLearning during the pandemic, which required students to log in from home. As scenario planning begins for fall, the ability to visualize students geographically to determine hybrid models, split schedules, and/or students who will remain remote for the beginning of the school year is vital to capturing the needs of each and every student in the planning process. Understanding where students are located geographically and what their needs are will remain an important considerations for leaders going forward.
Administrators are utilizing geovisual analytics to address questions regarding:
- Digital Divide challenges:
- Where are the students located who are struggling with no access or haven’t logged in all spring?
- Where do we need to provide hotspots or other options to enable connectivity?
- What support can local providers supply and where is that support needed most?
- Scenario Planning for Fall Return
- How will we ensure equitable balance in all buildings as we reduce class sizes to accommodate split or alternating day schedules?
- How will each building be zoned for the various models?
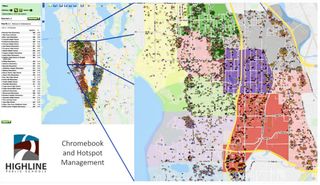
Mark Finstrom, CTO from Highline Public Schools in Washington, used GuideK12 to track where devices were placed, what the device was, and if the device had connectivity. Looking at additional characteristics, such as socio-economic status and single vs. multi-family dwellings, enabled him to determine where to deploy hot spots and how many were required to provide proper access.


Using Data to Plan for a Variety of Return-to-School Scenarios
This past spring, many districts were in emergency mode, so accommodations and exceptions were made regarding grading standards. Students on IEPs or with special needs may have not been able to receive all of their traditional support or services when schools were suddenly moved into distance-learning mode.
As schools develop more robust instructional plans for next year, there are many more questions that will need to be answered using analytics, including:
- Are students grade-level ready or did the extended break create a gap for some?
- Which students are completing the assignments?
- Are there certain subjects that the students are struggling with more online?
- Where are the areas of disproportionality within the district and what is being done to address the achievement gap?
- Are students on-track in terms of readiness for their college and career plans?

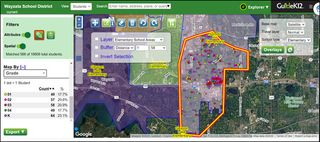
As a result of the significant number of questions that remain surrounding what a return to school will look like in the fall, districts are creating multiple “what if” scenarios to ensure that they are prepared. Kristin Tollison from Wayzata Public Schools is using GuideK12 to accomplish this, as her district explores all of the possible return-to-school scenarios to ensure that even a split-schedule classroom is consistent with the building’s overall demographics and not skewed by the selection process.

Finding and Funding the Right Tools
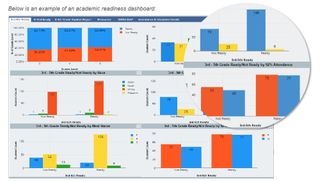
CARES Act funds and local state funds could provide a mechanism for districts to purchase tools to answer the important questions tied to access and eLearning. One such tool is 5Lab™ from Forecast5, an analytics tool that provides school districts and building leaders with critical dashboards to monitor student performance, whether in a traditional, remote, or blended learning environment.
Many tools provide districts with log-in information on students entering an eLearning platform. However, it’s critically important that leaders are able to assess and understand what is actually happening while students are logged in. What is the actual level of student activity? How engaged are they? What is their degree of comprehension? The answers to these questions, when tied to student characteristics, are key to ensuring students aren’t falling behind. They can also help identify if an instructor is struggling with the online setting, which might affect student progress.
“After school ended, we had our school improvement meeting and shared 5Lab examples. Our high school administrative team immediately saw the benefits of how helpful this will be during eLearning instances, not only if we do have an extended ‘stay away’ period, but even if we’re in the school building. It gives them examples to look at to see how active kids are with their learning,” commented Lynn Schemel, Director of Data Systems and Assessment at Westfield Washington Schools.
Preparing for the New Normal
Many factors are at play in this “new normal.” Having the ability to explore the variables, both at the grade and building level as well as at the student and teacher level, will ensure administrators can provide students with what they need to continue to learn and answer important “where” questions with tools such as GuideK12.
The ability to track and assess online learning, as well as traditional classroom learning, for determining student progression requires proper metrics. Analytic tools like 5Lab, which answer these critical questions will provide a more focused, relevant way of ensuring every child continues to learn despite the obstacles brought on by the pandemic.
Find out more at www.Forecast5analytics.com, check out their special site of COVID-19 resources here:https://www.forecast5analytics.com/covid-19-resources , or contact jfitzgerald@forecast5analytics.com for more information.
Tech & Learning Newsletter
Tools and ideas to transform education. Sign up below.
