What is Piktochart and How Does It Work? Best Tips and Tricks
Piktochart is a visual story creator that can make project presentation far more rich for students and teachers

Piktochart is a powerful yet easy-to-use online tool that allows anyone to create infographics and more, from reports and slides to posters and flyers.
This tool is built to work digitally but can also be used in print since it is aimed at professional use. This means the quality is high and it is feature-rich so it works well in education also.
Students and teachers can turn otherwise dry data into graphically engaging and even entertaining visuals. From graphs and charts to text, this will add graphics and make that information more accessible.
Read on to find out everything you need to know about Piktochart.
What is Piktochart?
Piktochart is part of the growing offering of digital tools that allows even those with graphic design skills to create visually striking infographics. It does this by making everything online with simple-to-use controls and self-explanatory features. Think what Instagram photo filters do for images where previously you'd need Photoshop skills, only this applies to all sorts of uses.

Piktochart might be aimed at adults in the working world who want to create engaging presentations, but that works well in the classroom too. Since it is so easy to use, it offers a way to work quickly, transforming information into engaging content.
From leaflets and posters to charts and stories, this has a huge range of functional options to pick from, and since it's online, it is always growing and improving. Change images, graphics, and fonts, and upload your own content to create a personalized finish.
Tools and ideas to transform education. Sign up below.
How does Piktochart work?
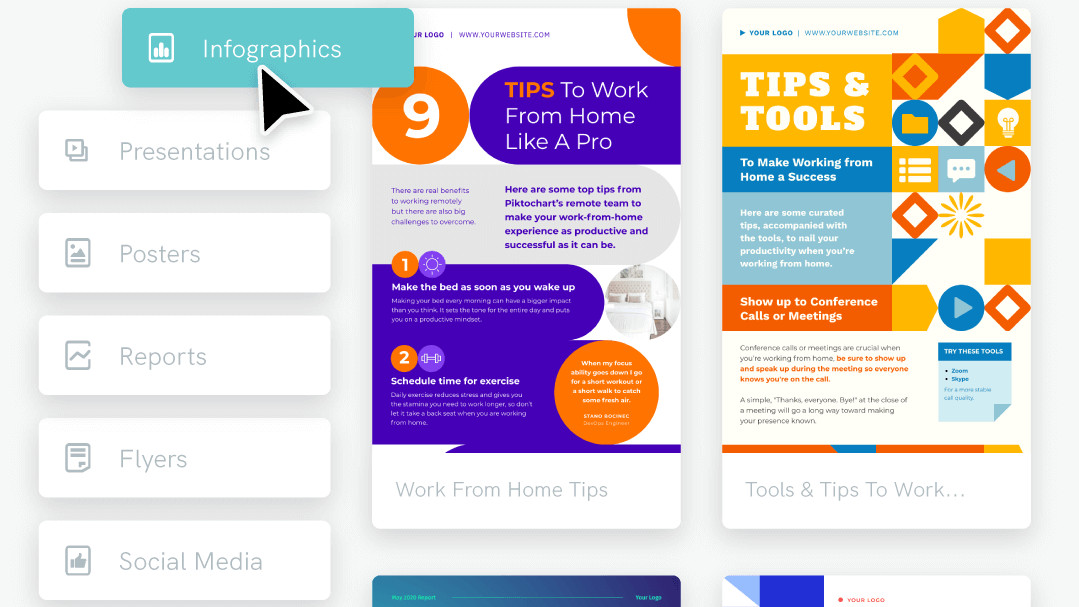
Piktochart starts off with a selection of templates from which to choose. If you're not set on a particular outcome, then you can find something to work with fast and will have your final design all done very quickly. That said, you can add your own images, fonts, and more to get a very specific end result, if that's what you need.

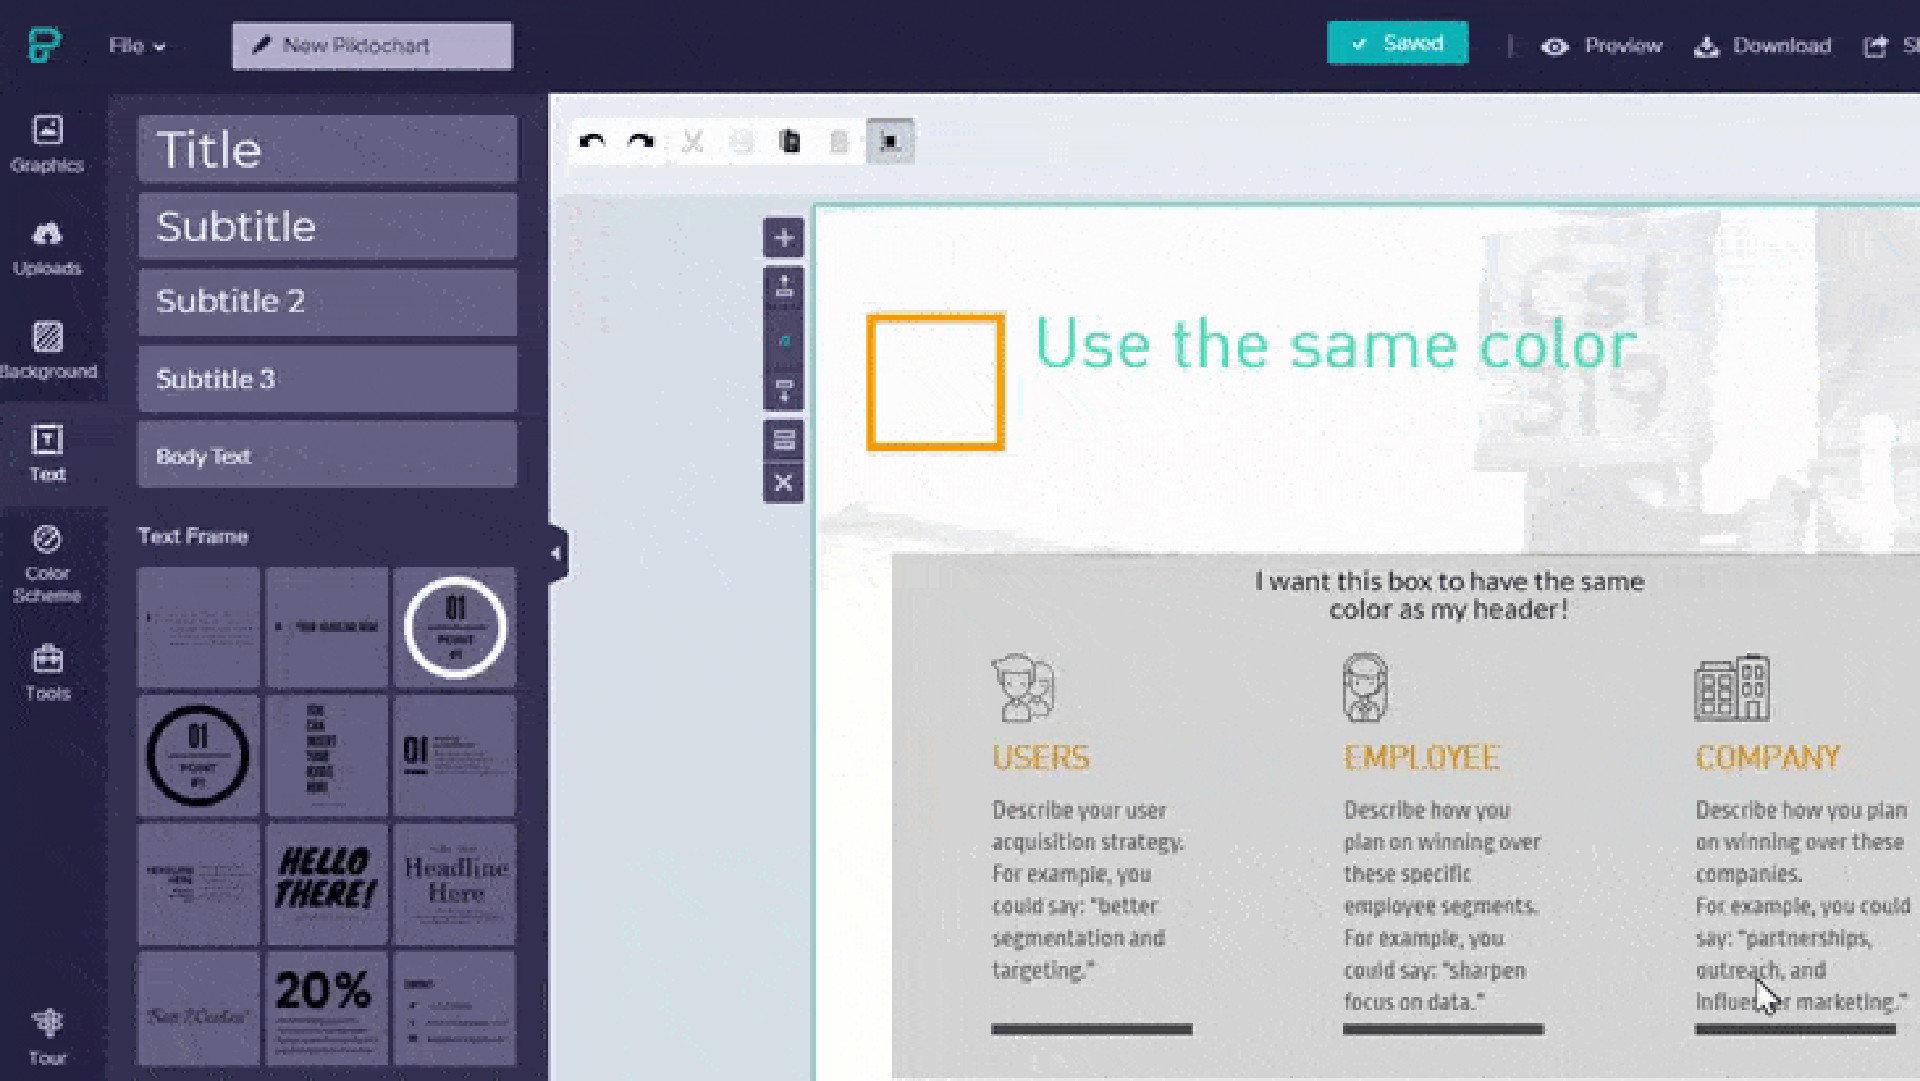
Some example templates on offer include a flyer, checklist, social media post, presentation, and plan. You can then pick from a whole host of images, fonts, icons, maps, charts, shapes, videos ,and more to insert into the project.
Much of this is organized in a way that makes searching far easier than simply scrolling. Subject sections make it more intuitive, with education as one such section, but there is also people, entertainment, and more.
Creating charts is also made to be easy with each chart supported by a mini spreadsheet. It's here that students, and teachers, can add data that will then automatically be converted into a visually striking output.
Once finished, students can chose to save this online or export as a PNG or PDF with varying quality levels, although the top end ones require a Pro account, but more on that below.
What are the best Piktochart features?
Piktochart has some great features, both readily available and those for the Pro version. One feature that works on both is the ability to share the project on social media. This can be a great way to get students into the platform, as they may use it in their spare time as well as for class projects.
Team accounts allow students to work together on projects so as to learn to work collaboratively but also as a way to work remotely as a team.

A wide selection of material is available to help students learn how to best use the Piktochart service. From tutorial videos, many of which are in Spanish, to a knowledge base with blog posts and design tips – there's plenty students can access to improve on their own time.
Pro accounts can set up specific branding that can apply to the entire school, the class, or individual students. Colors and fonts are designed specifically for that, so it's instantly recognizable and stands out from the usual template-made content.
How much does Piktochart cost?
Piktochart offers education pricing aimed at professional use and for team use, however, there is also a standard tier that offers a free account.
Free gets you up to five active projects, 100MB of storage for image uploads, unlimited templates, images, illustrations and icons, unlimited charts and maps, plus the ability to download as a PNG.
Go for the Pro tier at $39.99 per year and you get 1GB of image upload storage, watermark removal, unlimited visuals, export in PDF or PowerPoint, password protection, own color schemes and fonts, plus visuals organized in folders.
Upgrade to the Team option at $199.95 per year, and you get five team members, 1GB or image storage per user, secure SAML single sign-on, custom templates, project sharing, comments on team visuals, plus the ability to set roles and permissions.
Piktochart best tips and tricks
Create a stunning syllabus
Imagine coming to class only to see a stunning, professional-looking infographic printed and posted on the wall. It would grab your eye! So fill that with important syllabus information and your students will be starting term on the right foot.
Create a social media contract
Yes, this tool is good for social media posting, but if you're dipping into that murky world, why not use the very same tool to firstly create a contract? Include positives and negatives, agreed respectful use cases, and leave space for students to actually sign.
Use a skills list
Create a skills list that's visually engaging so your student won't forget it. Then revisit as they hit goals and fill in what they've achieved. At the end of term print it and gift it to each student as a reward.
Luke Edwards is a freelance writer and editor with more than two decades of experience covering tech, science, and health. He writes for many publications covering health tech, software and apps, digital teaching tools, VPNs, TV, audio, smart home, antivirus, broadband, smartphones, cars and much more.
