Use DataClassroom to Teach Graphing, Data Analysis and Statistics
By TL Editors
published DataClassroom helps teachers store, manipulate, and analyze data sets

DataClassroom
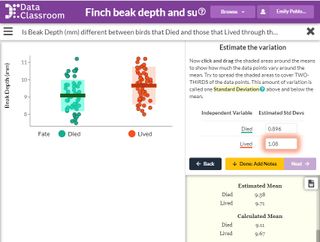
Statistical analysis for science classrooms made easy
Pros: Helps students visualize what certain statistical tools can tell us about data.
Cons: Most of the actual calculations and data analysis is done for the students.
Bottom Line: Perform a t-test or chi-square analysis using your own data or provided data sets.
Read more
App of the Day picks are selected from the top edtech tools reviewed by Common Sense Education, which helps educators find the best ed-tech tools, learn best practices for teaching with tech, and equip students with the skills they need to use technology safely and responsibly.

Tech & Learning Newsletter
Tools and ideas to transform education. Sign up below.
More about classroom tools


